Illustrative Mathematics Annual Report
Bringing a year of progress to life through vibrant, engaging design
Project Summary
An annual report highlighting Illustrative Mathematics’ objectives and accomplishments across its initiatives. Created for stakeholders and donors, the report communicated the organization’s progress while reflecting the energy and personality of its culture.
My Role
Creative Director / Senior Graphic Designer
The Challenge
The report needed to feel vibrant and energetic, but the brief offered little specific visual direction. The client’s approach was largely “we’ll know it when we see it,” making the central challenge translating an abstract sense of company culture into a clear, cohesive design.
The report also needed to make substantial information accessible, balancing an expressive visual style with clear communication of objectives and accomplishments.
The Creative Approach
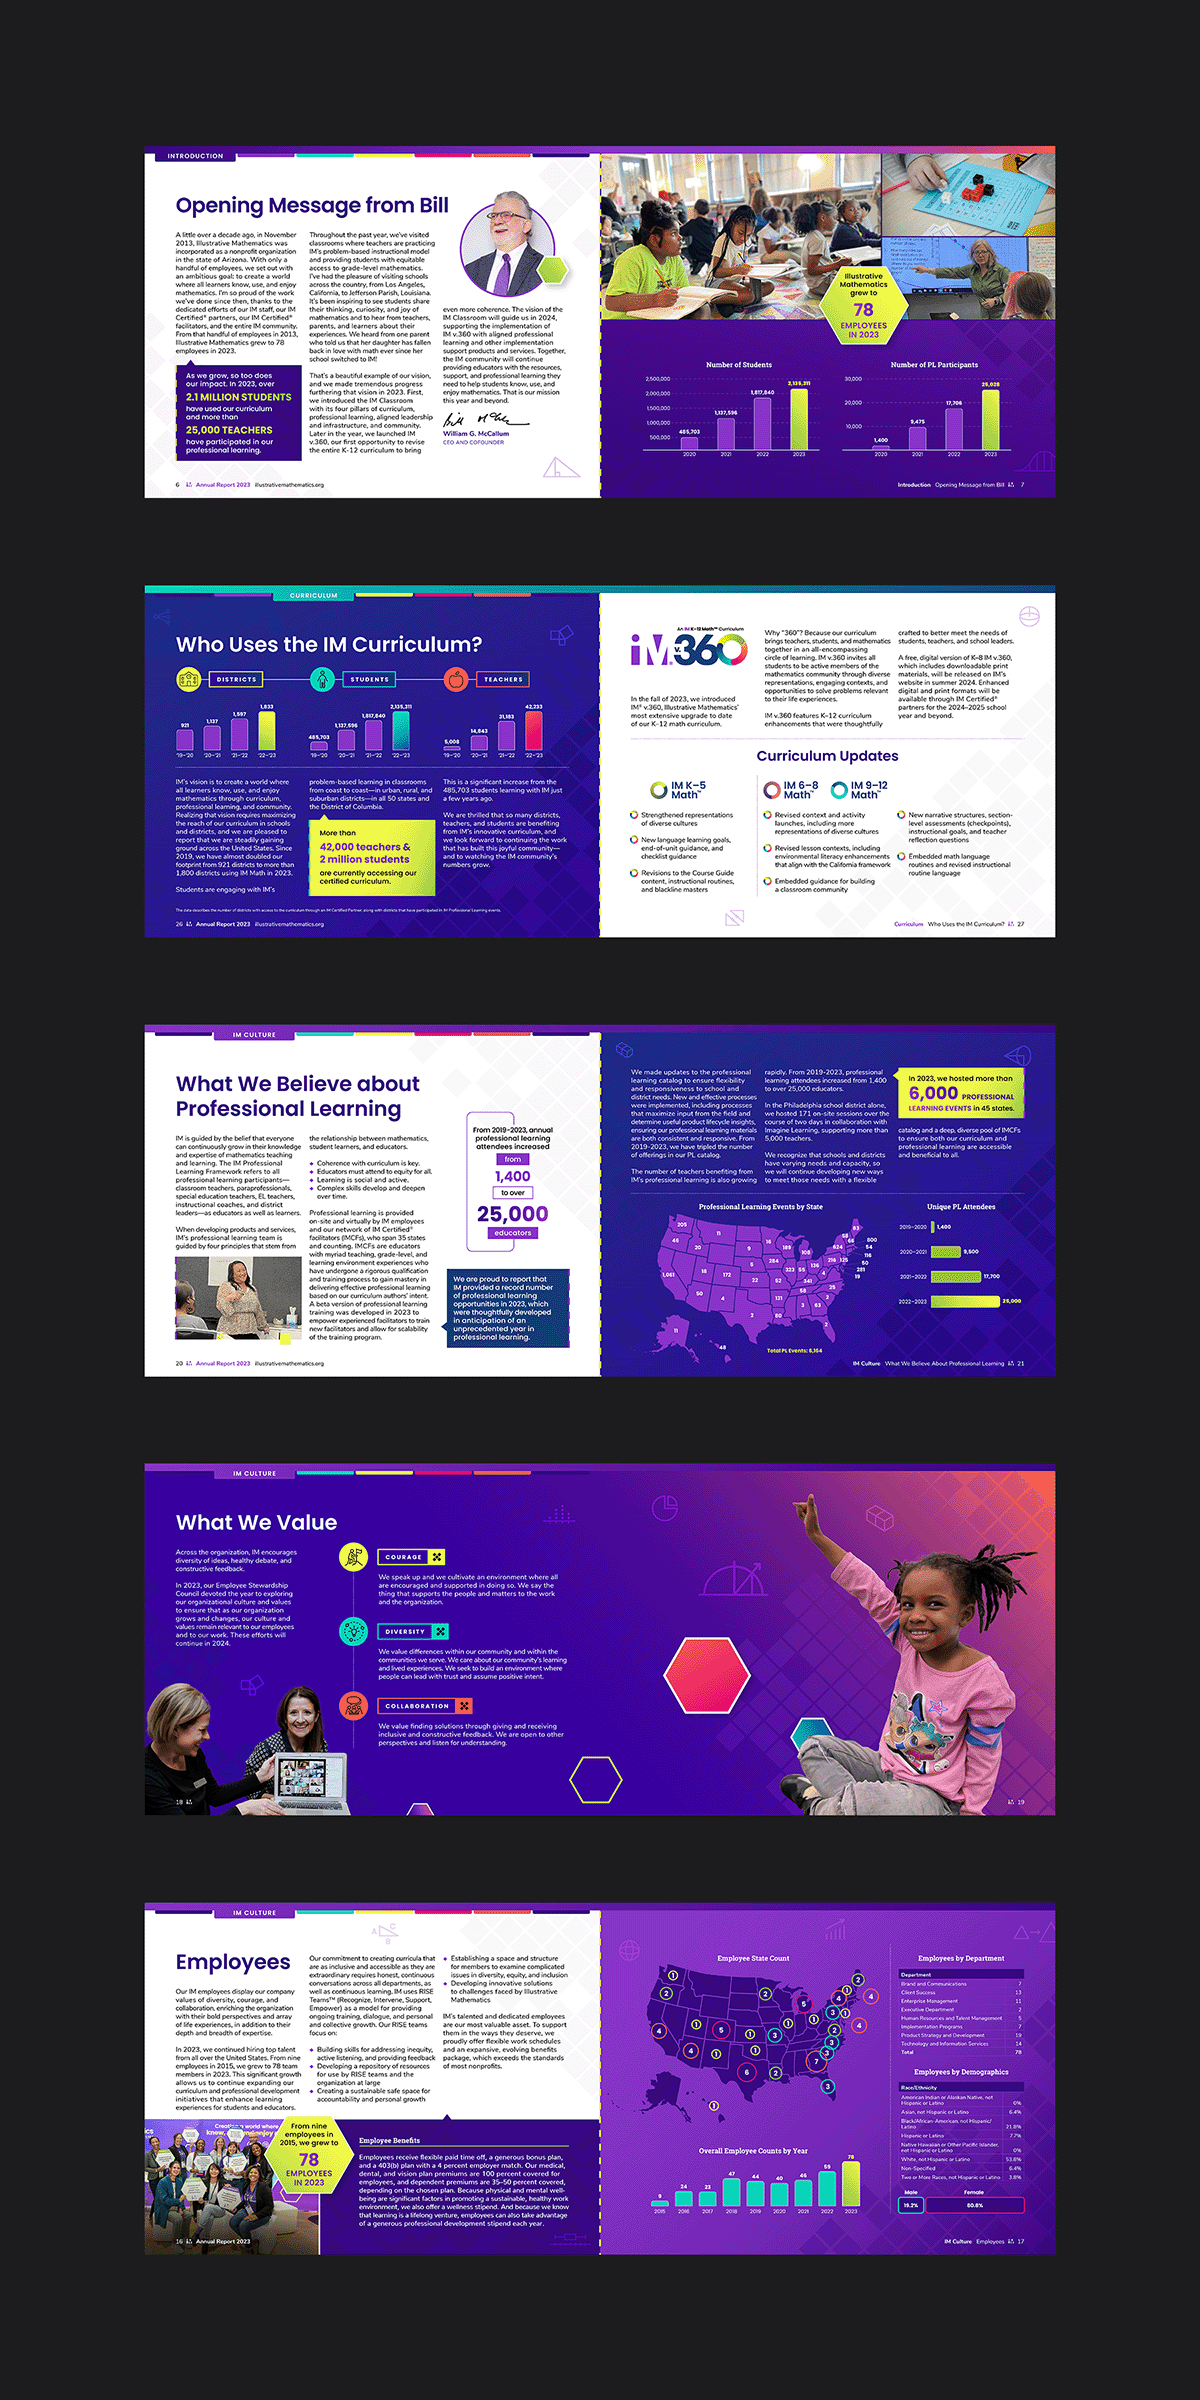
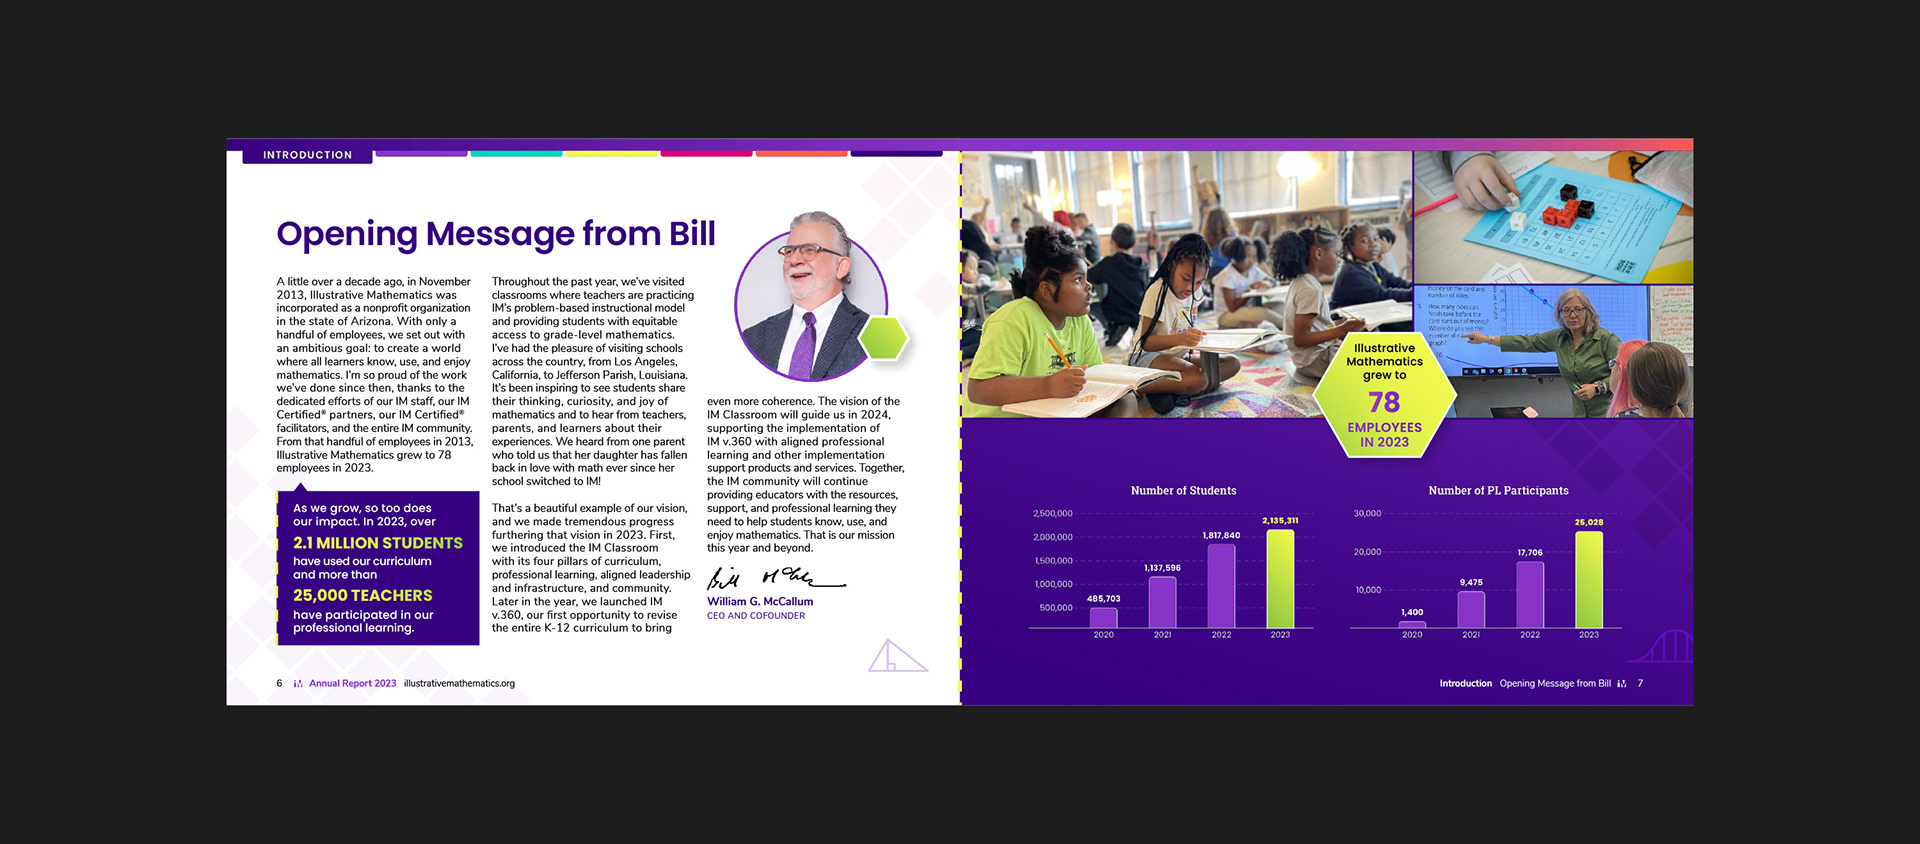
A vibrant color palette, layered gradients, and a landscape format gave the report an energetic, distinctive feel. Background patterns, floating math icons, and dashed dividers added personality, while cutout photography and callout boxes with drop shadows created depth and helped key elements jump out. Playful infographics added visual interest while making information easier to understand, and interactive tabs along the top made the report interactive.